Click on the Task introductions below to see model answers
Single Time (Static)
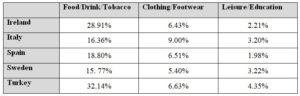
The table below gives information on consumer spending on different items in five different countries in 2002 [click to open model answer].
Change Over Time
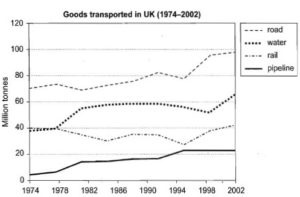
The graph below shows the quantities of goods transported in the UK between 1974 and 2002 by four different modes of transport.
Process Diagram
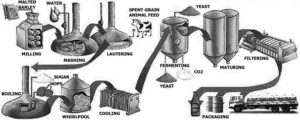
The diagram below shows the various stages involved in the production of beer.
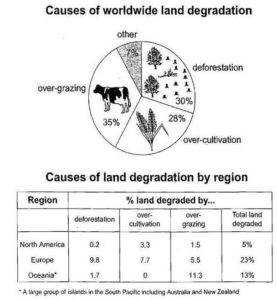
Map
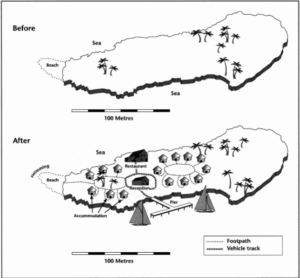
The two maps below show an island, before and after the construction of some tourist facilities.
Future Period
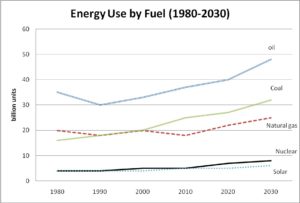
The graph was published in 2010 and shows energy use by different types of fuel in Australia.
Multi-Chart Type
[This type of task includes more than one type of chart.]
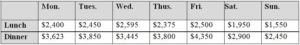
Limited Data
The table below shows the sales at a small restaurant in a downtown business district.
Useful Links
eBook for Task 1 Academic
Complete writing eBook
Get your writing corrected
Join my website to receive updates
Task 1 academic on my website