Steps in planning a task:
1. Read and underline key vocabulary in the question and write words with the same or related meaning.
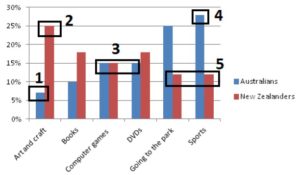
The graph below shows information about the activities that Australian and New Zealand
bar graph illustrates data recreational pursuits Australians New Zealanders
children enjoy doing the most in 2007.
youths favourite2. Check whether the data is about percentages or numbers.
percentages3. Brainstorm key points for the answer, look for the following:
1 = lowest % for Australians
2= highest % for New Zealanders
3= same % for Australians AND same % for both nationalities for computer games
4= highest % for Australians
5=same % for New ZealandersBelow are some additional points worth mentioning.
6= the second lowest % for Australians
7= the second to highest % for New Zealanders (for two categories)
8 = the second to highest % for Australians4. Work out the overall summary. There should be one or two key points that must be mentioned.
For this task it could be the highest and lowest percentage for each country. But even more cleverly, it can be pointed out that Australians preferred outdoor activities and New Zealanders preferred indoor ones. This is because the top two percentages for Australians are both outdoor activities; and for New Zealanders the top two percentages are for indoor activities.5. Plan the structure of the answer (how can the data be grouped).
Introduction = rephrase of the task introduction + overall summary
Australians = highest to lowest percentages
New Zealanders = highest to lowest percentages6. Write the task.
Model answer:
The bar graph illustrates data about the favourite recreational pursuits of children in two nations in 2007. Overall, Australians were more likely to do outdoor activities, whereas New Zealanders were more involved in indoor activities.For Australian youths, the most popular activity was doing sporting activities, which accounted for approximately 28%. Next, a quarter of Australians enjoyed visiting parks. The third most popular leisure pursuits were video games and watching movies, which both attracted 15%. The least popular activities were reading, and art and craft, which accounted for about 10% and 7 %, respectively.
Turning to the young New Zealanders, the highest proportion of young people enjoyed doing art and craft, which accounted for 25% of them. This was followed by reading books and watching movies, which each accounted for roughly 17%. The proportion who played video games was only 15%. The least popular were trips to the park and playing sports at 13%. [154 words]
Double pie task
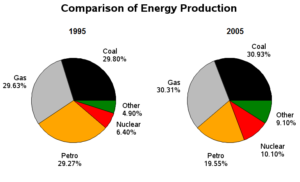
Often in the IELTS Task 1 academic exam you are given two pie charts. With two pie charts you can structure the body of your report either with a paragraph for each pie chart or by the categories of each pie. Each one has advantages. Structuring the essay with a paragraph about each pie chart is an easy structure, and you have two clear body paragraphs. You focus mostly on the highest and lowest figures of each pie chart and the comparison usually comes in the overall summary. It is also quicker to write.Structuring the essay by categories of the chart allows for more comparisons to be made and can result in a better coverage of the data. It can be more difficult for the reader to see your structure if it is not written carefully. It can be harder to get logical body paragraphs and can just end in one big body paragraph. Getting logical separation of data has to be done on a case by case basis depending on the data of the particular task. For instance a paragraph could be written about the highest proportions and another one about the lowest proportions only if the highest and lowest proportions are the same in each pie graph.
I would pick ONE way, and always use this structure, so that you have it perfected before your exam. If your goal is 7 the safest way is by pie, but if you really want to get to 8 it could be worth the risk of going by category.


