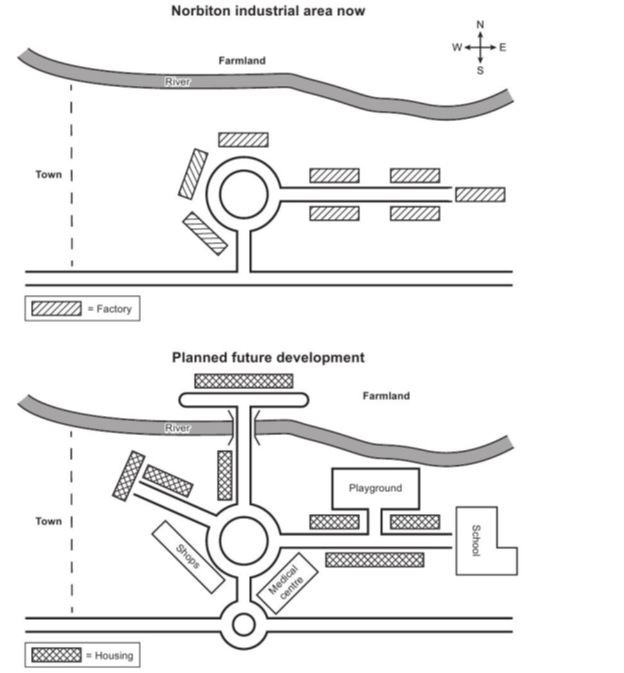
The maps below show an industrial area in the town of Norbiton, and planned future development of the site.
COLLEAGUES ANSWER
Note: I think this answer by my colleague is much better than the one I wrote below. I think the reason why is that it is better to structure this task by map and not by north-south of the map
SAMPLE ANSWER: structured by Map 1 followed by Map 2
Two illustrations are provided showing the manufacturing quarter of a town called Norbiton at present and the future layout. Overall, this area will be completely transformed into a residential area.
At present, the area is located east of the town with a river running from the west to the east in the north, north of which is farmland. In the middle, there is a roundabout with two exits, one of which links to a main road in the south and the other is oriented towards the east, and some factories are scattered on both sides of it as well as around the roundabout.
In the future, two new exits will be added to the roundabout. One heading northwest and the other north, which will cross a newly added bridge allowing access to new housing, leaving only the countryside in the northeast. A small roundabout, will be constructed on the main road, linking to the large roundabout. The factories will be replaced with housing and facilities such as shops and a medical centre. A school will be built in the east with a new park located nearby.
MY FIRST ATTEMPT
Note: I wrote this and do not feel happy with it. I feel it is long and difficult to read. I am asking a colleague to have a go and I will put his answer on here soon. Bookmark this page!
SAMPLE ANSWER: structured by North and South of the map
Town plans show an industrial area to the east of the town of Norbiton and plans for its future development. Overall, the proposal is to transform Norbiton from an industrial area to a residential area with associated facilities.
In the far north of the map, houses are planned to be built on farmland. A road in front of it leads to a bridge that crosses over a river. This bridge leads to a road, with housing to the west. The new road meets a ring road currently located in the centre of the zone. It is proposed to remove all the factories around the ring-road.
Turning to developments in the southern section of the map, branching off the ring-road westwards is a new road with housing constructed along it. Another road branches to the east of the ring road with new housing and a playground, and a school at the end of the road. All factories will be removed from this road. Finally, branching off the ring-road towards the south the current road will have shops on the west and a medical complex on the east, and the road will lead to a new roundabout that replaces the current T-intersection.
[200 words]
The table and charts below give information on the police budget for 2017 and 2018 in one area of Britain. The table shows where the money came from and the charts show how it was distributed.

VERSION 1: organised by chart
The table illustrates how a police force in a British region was financed between 2017 and 2018; while the pie charts depict the distribution of those funds during the same period. Overall, the police received the most funding from the government in both years; meanwhile, police officer and staff wages, albeit the highest in both years, decreased.
Starting with funding, in 2017 the total funds received was £304.7 million. Over half of which was from the national government, at £175.5 million while the remaining came from local taxes and other sources, with £91.2 million and £38 million respectively. By 2018, the total budget had grown to £318.6 million. Specifically, the amount from the national government rose slightly to £177.8 million and local taxes contributed £102.3 million. The figure for other sources increased marginally to £38.5 million.
Turning to the expenditure, salaries for officers and staff were the highest in both years, with 75% in 2017 and it fell to 69% in 2018. Technology received 8% initially but the proportion almost doubled to 14% in 2018. Buildings and transport had the same proportion of 17% in each year.
[187 words]
VERSION 2: Organised by time
The funding of a police force in a British region between 2017 and 2018 is highlighted in the table while the distribution of those funds during the same period is shown in two pie charts. Overall, the total funding increased; meanwhile, technology was the only area whose expenditure increased.
Starting with 2017, the total money received was £304.7 million, £175.5 million of which came from the national government; while the remaining came from local taxes and other sources, with £91.2 million and £38 million respectively. The highest expenditure of 75% was on officer and staff renumeration followed by buildings and transport at 17%. The lowest funding allocation, namely, 8% went to technology.
Moving onto 2018, despite a fall, expenditure on wages was still the highest at 69%, while technology rose to 14% as well as this buildings and transport stayed the same with 17%. By this time the total budget had grown to £318.6 million. All sources increased, specifically, the amount from the national government rose slightly to £177.8 million. At the same time and other sources ended up with £102.3 million and £38.5 million, respectively.
[186 words]
The chart below gives information about how families in one country spent their weekly income in 1968 and in 2018.

The graph below shows the number of shops that closed in the number of new shops that opened in one country between 2011 and 2018.

Structured by opens and closes
The line graph illustrates how many stores ceased trading and opened in a particular nation from 2011 to 2018. Overall, the number of closures and openings experienced a downward trend during the period with significant fluctuations resulting in the lead changing several times.
[Change to include higher lower and the amounts]
Starting with closures, in 2011 they were lower than opens with approximately 6,500, then they subsequently decreased to 6,000 in 2012, despite this, closures became higher. The figure reached a peak of over 7,000 in 2013 and fell to around 6,600 in 2014. It then plummeted to just under 1,000 in 2015, returning to the lowest position but it subsequently soared back to the lead, reaching 5,000 by 2016, it remained steady to reach just over 5,000 by 2018.
Moving onto new stores, the figure was higher than opens in 2013 with about 8,500 and it fell to just under 4,000 in 2012. There was a slight rise in 2013 and 2014 to 5,000 and just over 6,000, respectively and then the figure fell back to around 4,000 for the next three years before ending up as the lower of the two categories with 3,000 in 2018.
[188]
Structured by time
The line graph illustrates how many stores ceased trading and opened in a particular nation from 2011 to 2018. Overall, the number of closures and openings experienced a downward trend during the period with significant fluctuations resulting in the lead changing several times.
Commencing with the initial four years, in 2011 openings were higher than closes with approximately 8500, whilst closures stood at around 6500. Both declined and by 2012 openings had dropped below closures to just below 4,000 whilst closures sat at 6,000. Closures subsequently rose to peak at slightly over 7,000 before falling back to about 6,500 in 2014; whilst openings had a steady increase to reach slightly above 6,000.
Turning to the remaining period, by 2015 closures had fallen dramatically to about 750, putting it well below openings, whilst openings had a moderate decline to 4,000. It remained at that figure in 2016 but it then rose slightly in 2017; after which it dropped to 3,000. However, closures bounced back reaching approximately 5,000 in 2016, once again overtaking openings. It had a slight drop in 2017 but ended up back to just above 5,000 in 2018.
[190 words]
Get the score you need by using my IELTS writing correction and feedback service by a trained examiner to increase your score. I check your writing tasks and give you feedback on errors and ways to improve your writing. I will also give you a score for each of the four grading criteria.
https://www.ieltsanswers.com/writing-correction-ielts.html