The pie chart below shows the main reasons why agricultural land becomes less productive. The table shows how these causes affected three regions of the world during the 1990s.
Model Answer:
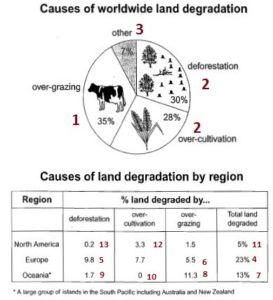
The pie chart illustrates the main causes of the deterioration of global farmland and the table gives data regarding the influence of these causes on three areas during the 1990s. Overall, over-farming was the leading cause of global land degradation and the Eurozone had the highest proportion of degraded land.
With regard to global land degradation, the leading cause was over-farming at 35%. This was closely followed by cutting down forests and growing too many crops, which accounted for 30% and 28%, respectively. Other reasons were only responsible for 7% of the damage.
Turning to the individual areas, Europe had the highest proportion of land that was less fertile at 23%. The main cause was deforestation at 9.8% and the least was over-farming at 5.5%. Oceania had 13% of its land that was degraded and this was caused by overgrazing at 11.3% and deforestation at a much lower 1.7%. There was no damage due to over-cultivation in Oceania. North America had the lowest proportion of arable land damaged at 5%. The biggest cause was over-cultivation at 3.3% and the least was the removal of forests, at 0.2%. [187 words]
Task Analysis:
Time: static
Fewest category: not applicable, structure by graph
Note:
The table does not show countries; it shows regions.
Language:
land degradation = deterioration of global farmland, degraded land
over-grazing = over-farming
deforestation = cutting down forests, removal of forests
over-cultivation = growing too many crops
Useful Links
eBook for Task 1 Academic
Complete writing eBook
Get you writing corrected
Join my website to receive updates
Task 1 academic on my website