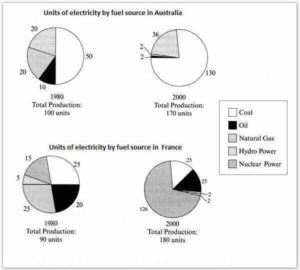
The pie charts below show units of electricity production by fuel source in Australia and France in 1980 and 2000.


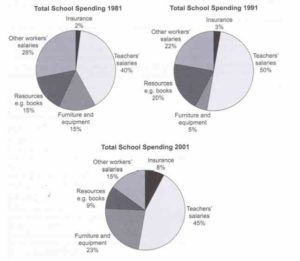
The pie charts compare the expenditure of a school in the UK in three different years over a 20-year period.

You can get more sample tasks by looking at the tasks I have corrected for students
[eBook available with all the common types of tasks for the Academic test…including maps and future predictions!]


