Task 1 Academic in 20 minutes
|
You should spend about 20 minutes on this task The graph below shows information about the activities that Australian and New Zealand children enjoy doing the most in 2007. Summarize the information by selecting and reporting the main features, and make comparisons where relevant. Write at least 150 words |
What Children enjoy doing
Model answer:
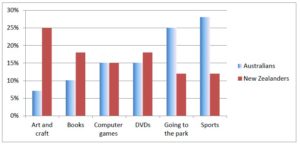
The bar graph illustrates data about the favourite recreational pursuits of children in two nations in 2007. Overall, Australians were more likely to do outdoor activities, whereas New Zealanders were more involved in indoor activities.
For Australian youths, the most popular activity was doing sporting activities, which accounted for approximately 28%. Next, a quarter of Australians enjoyed visiting parks, which was about double the number of New Zealanders. The third most popular leisure pursuits were video games and watching movies, which both attracted 15%. The least popular activities were reading, and art and craft, which accounted for about 10% and 7 %, respectively.
Turning to the young New Zealanders, the highest proportion of young people enjoyed doing art and craft, which accounted for 25% of them. This was followed by reading books and watching movies, which each accounted for roughly 17%. The proportion who played video games was only 15%, which was the same as the Australians. The least popular were trips to the park and playing sports at 13%. [170 words]
Steps in completing the model task:
1. Read and underline key vocabulary in the question and write words with the same or related meaning.
The graph below shows information about the activities that Australian and New Zealand
bar graph illustrates data recreational pursuits Australians New Zealanders
children enjoy doing the most in 2007.
youths favourite
2. Check whether the data is about percentages or numbers = percentages
3. Brainstorm key points for the answer, look for the following:
1 = lowest % for Australians
2= highest % for New Zealanders
3= same % for Australians AND same % for both nationalities for computer games
4= highest % for Australians
5=same % for New Zealanders
Below are some additional points worth mentioning.
6= the second lowest % for Australians
7= the second to highest % for New Zealanders (for two categories)
8 = the second to highest % for Australians
4. Work out the overall summary.
For this task it could be the highest and lowest percentage for each country. But even more cleverly, it can be pointed out that Australians preferred outdoor activities and New Zealanders preferred indoor ones. This is because the top two percentages for Australians are both outdoor activities; and for New Zealanders the top two percentages are for indoor activities.
5. Plan the structure of the answer (how can the data be grouped)
Introduction = rephrase of the task introduction + overall summary
Australians = highest to lowest percentages
New Zealanders = highest to lowest percentages
6. Write the task (The model answer is written above).
7. Proofread the task
thanks for your elaborated answer. i argue that we have to writing in a comparison style between the two countries in the same paragraph . this approach might target towards task achievement instead of writing data of each country in an isolated paragraph.
regards
I agree that the structure you suggest will make it easy to compare the two countries. It is more difficult structure, but it can lead to a higher score for task achievement.