Model answers for IELTS writing task 1 academic reports for Cambridge book 16. Learn from my model answers so that you can get the score you need. Written by Mike Wattie, ex-IELTS examiner and author.
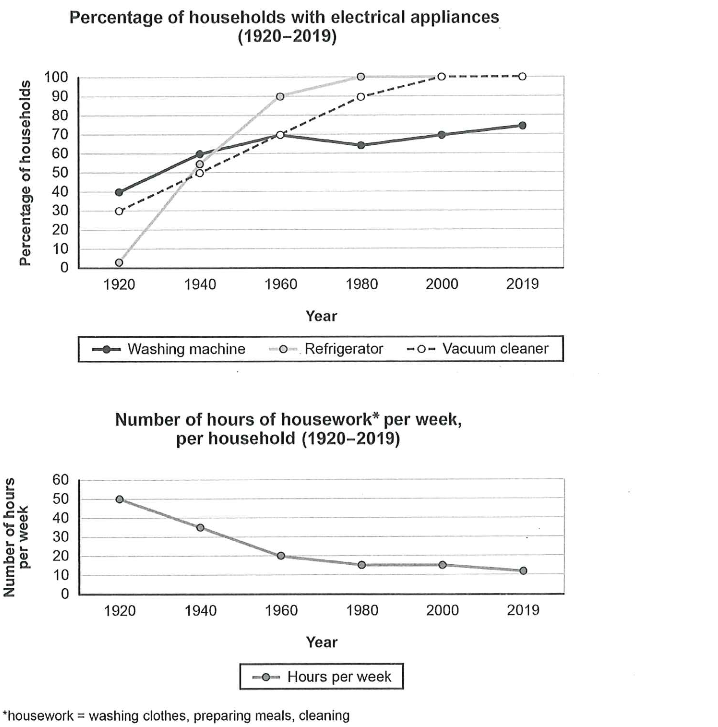
The charts below show the changes in ownership of electrical appliances and amount of time spent doing housework and households in one country between 1920 and 2019.
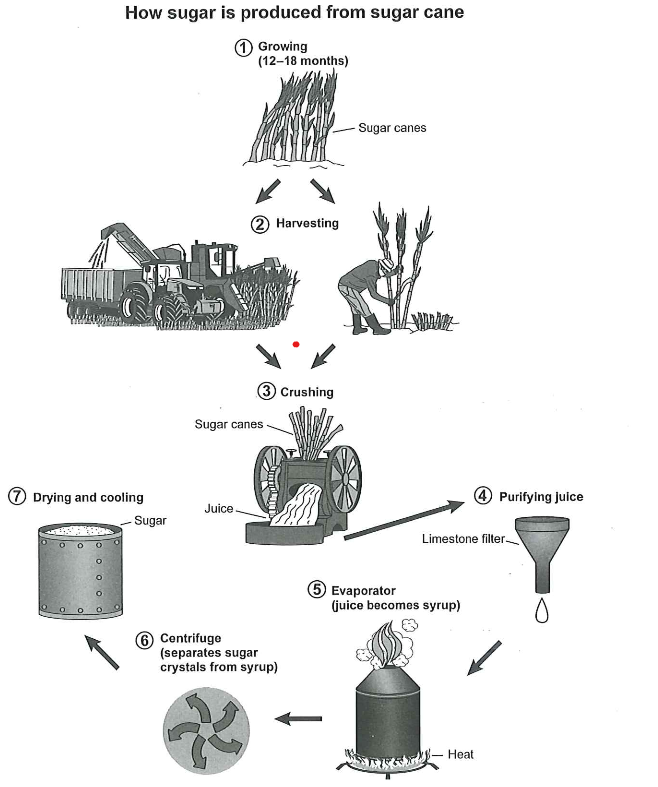
The diagram below shows the manufacturing process for making sugar from sugar cane.
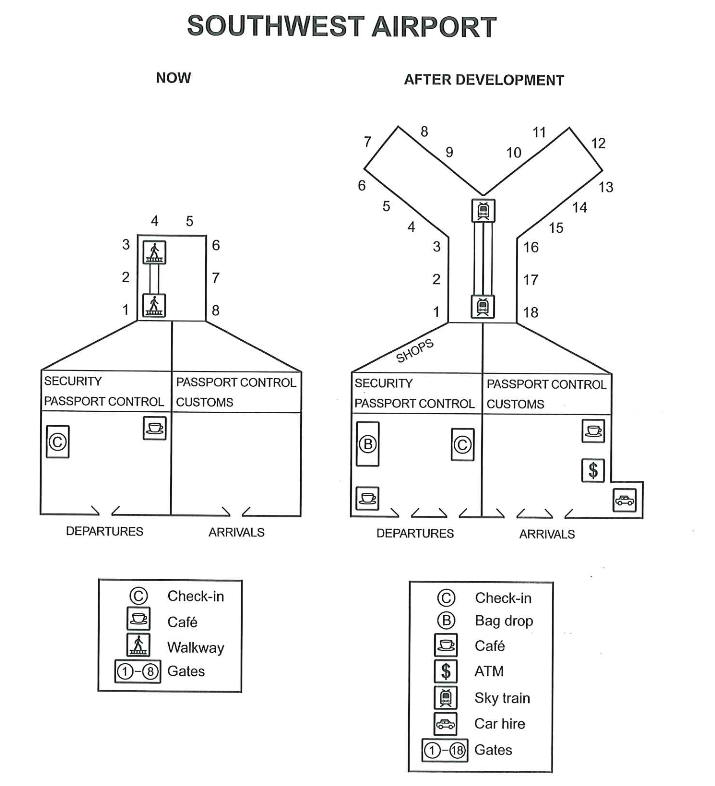
The plans below show the site of an airport now and how it will look after redevelopment next year.
The diagram below shows the process for recycling plastic bottles.
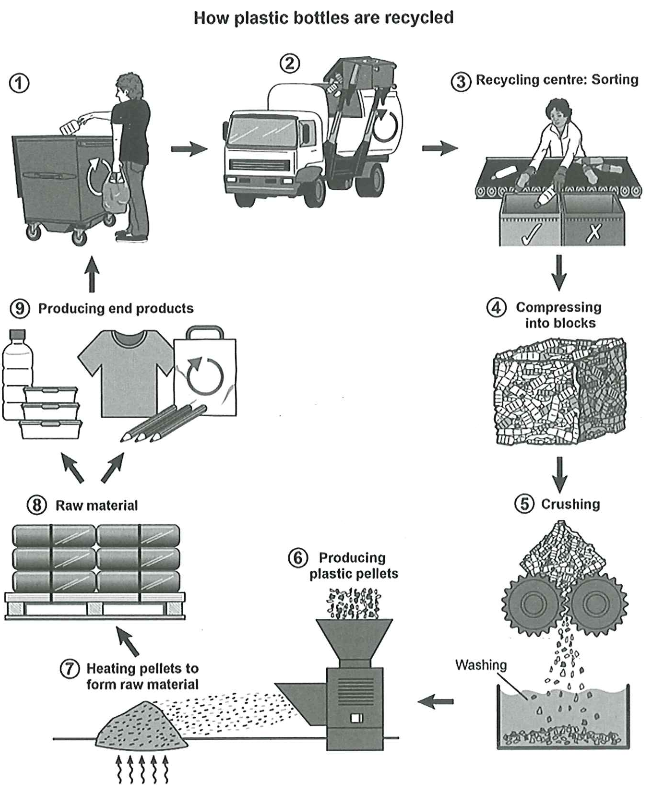
The process diagram illustrates how plastic bottles are recycled. Overall, there are nine steps starting with bottles being thrown in the trash, moving through factory processes using specialized machinery, and ending with products being made from recycled plastic, whereupon the process restarts.
Starting with the first three steps, which involve collecting and sorting plastic Initially plastic bottles are thrown into garbage bins. Next, garbage trucks collect these bins. Subsequently, the plastic bottles end-up in a recycling centre where they are sorted by hand into bottles that can be recycled and bottles that cannot.
The next stages focus on preparing recyclable plastic. This begins with compressing the recyclable plastic bottles together. These compressed blocks are then fed into a grinder that crushes them and transfers them into a tank where they are washed. Later, the plastic is put into a machine that transforms it into pellets.
Looking at the remaining stages, the plastic pellets are heated and turned into raw material suitable for making plastic products, which is stacked on pallets for storage. After this, finished products are created from the raw material. Some finished goods may end up being thrown out into trash cans and subsequently re-entering the recycling process. [186 words]
Get the score you need by using my IELTS writing correction and feedback service by a trained examiner to increase your score. I check your writing tasks and give you feedback on errors and ways to improve your writing. I will also give you a score for each of the four grading criteria.
https://www.ieltsanswers.com/writing-correction-ielts.html
can you please evaluate my task 1 essay?
The line graph illustrates the number of tourists who visited a Caribbean island between the years 2010 and 2017.
Overall, the number of tourists visiting a Caribbean island experienced an upward trend during the specified period of time. In addition, amount of people staying on cruise ships and the island showed fluctuations.
In 2010, 1 million people visited the island and the number increased significantly to 2.5 millions in 2014. Then it remained stable until 2016 and rose rapidly reaching its highest point at 3.5 million in 2017.
The number of tourists who stayed on the ,island fluctuated between roughly 0.25 million and 0.5 million during first four years of time period. However, the figure increased gradually by more than half to 2 millions over the 4 years period.
At the beginning of the period, about 0.75 million of visitors stayed on cruise ships, which rose considerably to 1.5 million in 2013. The figure remained constant for the next three years. This was followed by a slight decline reaching the point where it was surpassed by the number of visitors staying on the island. Finally the figure went back to the same level as in 2015 at 1.5 million in 2017.
Hey, could you give me a score and correct this answer
Writing Task 1 Sugar cane Manufacturing process
The diagram illustrates, the manufacturing process for making sugar from sugar cane.
The stages are elaborated widely, as follows:
The first and foremost stage is, “Growing” the sugar canes. The sugar canes are tends to be grown in the land for the production, The sugar cane needs 12-18 months inorder to be harvested. Then the sugar cane is extracted into manufacturing process for the ideal purpose of extraction of sugar.
The Second stage is, “Harvesting” the sugar canes. After the sugar canes reached their utmost growing period, sugar canes are harvested by human and at the same time it is harvested by the help of machinery, or said to be the harvesting machine. Which then piles up the sugar canes for the next upcoming process of extracting sugar from sugar canes.
The Third stage is, “Crushing” the sugar canes. The Piledup Sugar canes are transfered into crushing machine for extracting the juice from sugar canes, The sugar canes are bundledup and send it into the crushing machine, this stage consumes a lot of time and energy.
The fourth stage is, “Purifying Juice” of extracted juice. The Extracted juice from the crushing machine is altered into a limestone filter, in which it purifies the juice of sugar cane by filtering it. This stage block or prevent the tiny particles of sugar canes entering into the the next manufacturing process.
The fifth stage is, “Evaporator”, the filtered purified sugar cane juice is transfered into an evaporator, this stage involve heating the filtered sugar cane juice, which then converted as sugar syrup.
The sixth stage is, “Centrifuge”, This stage involves more difficulty, in which the sugar crystals are separated from the sugar syrup. Sugar crystals are shaped and formed into tiny particles called sugar.
The Seventh and the last stage is, “Drying and Cooling”, the final stage is to transfer the sugar crystals separated from sugar syrup, into containers to dry and cool. This is how the sugar is manufactered, and consumed for final production.
1. Learn how to use paragraphs
2. learn how to vary your language usage
3.learn how to write an overall summary
Overall score = 5.5
The diagram delineates the process of sugar production from sugar cane. Looking from an overall perspective, the procedure comprised seven steps commencing with growing sugar cane, the production process, and culminating with drying and cooling sugar.
Initially, sugar cane is cultivated for 12-18 months of period. The grown plants are harvested by hand or by a harvesting machine. Then harvested stems are transported to the factory to start the sugar preparation. After that, the well-grown stems are crushed in a crusher. In the crusher, the sugar cane juice is extracted into a container. After which extracted sap is sent through a limestone filter for purification. Purified juice is heated to form a syrup by evaporation.
In the sixth step, sugar syrup is sent to a centrifuge to separate sugar crystals. The formed sugar crystals are dried and cooled finally to produce sugar as an end product.
The process diagram illustrates the sugar manufacturing process using sugar cane. Overall, it takes seven steps to produce sugar from sugar cane.
Growing sugar cane was taken at least twelve or eighteen months which is the first step of this whole process. The second step is harvesting these canes after a few months later. Although it was the most difficult part in the past because all canes were harvested manually by people, now it becomes easy due to introducing harvesting machines to farmers. Then harvested canes were put crushing machine to get juice. Next, this juice is purified by using a limestone filter. Up to now first four primary steps are over.
In the fifth step put all juice into a container and heat up until the juice becomes syrup. This is called evaporation. The next step is Centrifuge, which means separating sugar crystals from the syrup. The final step is making sugar by drying and cooling sugar syrup.
For free I’ll give you the first three mistakes I notice and a rough score… If you want a thorough assessment please use my writing correction service
1 Growing sugar cane
was takentakes at least twelve or eighteen months2 The second step is harvesting these canes after a few months
later3 “most difficult part” this is your opinion and this is not actually shown and so this lowers your score for task achievement
overall about 6
For details about my writing service please refer to the link below:
https://www.ieltsanswers.com/writing-correction-ielts.html
The diagrams illustrate the change in ownership of electrical properties and how many times spended on housework in a household per week, between1920 to 2019. overall, the number of electrical appliances were increasing and time spent on houseworks was decreasing.
Looking first at the proportion of electrical appliances in families, all families have bought refrigerators and vacuum cleaners and only 70% of families bought washing machines ,in the year ended 2019. The number of refrigerators accorded for 0 in 1920 and rose shapely to half of proportion in 1940, then doubled in 1980 and continued this situation to 2019. vc only had one-third of ownerships starting in 1920, but the proportion slightly increased within the next80 years and met 100% in 2000 to 2019. The situation was different. It started at 40% in 1920, which is the highest starting proportion among the three categories, and rose to 70% in 1960 and fluctuated at this amount within 1980 to 2000. Although the level of owner of wm accorded for 70% in 2019, but already surpassed by both r and vc in 1960.
Moving to the time spent on houseworks per week, the number dropped from 50 hours in 1920 to 20 hours in 1940. The average time decreased to about 15 hours and continued at this level between 1980 to 2000, and finally decreased to 10 hours in 2019.
Task Achievement: The report provides an overview of the change in ownership of electrical appliances and time spent on housework in a household between 1920 and 2019, which satisfies the task given.
Coherence and Cohesion: The report is organized in a clear and logical manner, with the use of diagrams to illustrate the data. However, the report could benefit from more cohesive sentence structure and clearer connections between ideas.
Lexical Resource: The report uses a range of vocabulary related to the topic, but the language could be more precise.
Grammar Range and Accuracy: The report has some grammatical errors, such as incorrect verb forms and subject-verb agreement errors.
Overall, the report has some good points, but it could be improved by more precise language and more specific data and analysis.
Here are a few examples of grammatical errors in the previous report:
“all families have bought refrigerators and vacuum cleaners” – This sentence should be in past simple, “all families had bought refrigerators and vacuum cleaners”
“The number of refrigerators accorded for 0 in 1920” – This sentence should be “The number of refrigerators accounted for 0 in 1920”
“the proportion slightly increased within the next80 years” – This sentence should be “the proportion slightly increased within the next 80 years”
“although the level of owner of wm accorded for 70% in 2019” – This sentence should be “although the level of ownership of wm accounted for 70% in 2019”
“the average time decreased to about 15 hours and continued at this level between 1980 to 2000” – This sentence should be “the average time decreased to about 15 hours and continued at this level between 1980 and 2000”
would you mind giving me a score on my writing?
Please see here: https://www.ieltsanswers.com/writing-correction-ielts.html
Hey, would you mind giving me a score on my writing? Thanks
The process of recycling plastic bottles is detailed in the diagram shown. Overall, there are 9 steps to this cycle. Among them are using, collecting, transporting, sorting, compressing, crushing, producing, and reusing.
The first 3 stages focus on accumulating recyclables. It starts with people disposing of their plastic bottles into recycling bins, which then will be transported to a recycling plant by garbage trucks. Once there, a worker will sort them by hand between the recyclables and non recyclables.
After the recyclable bottles are collected, they will be processed into raw material to be repurposed. First, they are compressed into blocks and put through a round spiky grinder to be crushed into tiny pieces. Second, they will be gathered into tanks to be thoroughly cleaned before they go through a specialized machine that will turn them into plastic pellets. Third, the pellets are then heated to form raw material that is suitable for producing goods. The products that can be made, among others, are pens, shirts, and lunch boxes. These will then be used until worn out and can be collected in the recycling bin to go through the recycling process again.
The report provides a clear overview of the process of recycling plastic bottles and includes a diagram to help illustrate the information. However, the language used is quite simple and there are some grammatical errors such as “once there, a worker will sort them by hand between the recyclables and non recyclables” should be “once there, a worker will sort them by hand separating the recyclables from the non-recyclables”
In terms of the IELTS criteria, the report may receive a score of around 6 for Task Achievement, Coherence and Cohesion, and Lexical Resource. The report may receive a score of around 5 for Grammar Range and Accuracy.
need evaluation, please…
The given diagram demonstrates the procedure for reusing plastic bottles.
Overall, it is a nine steps process; it involves collecting disposed plastic bottles, sorting, compressing and crushing, producing pallets, and heating pallets to make them raw, which will then use in the production of products (plastic boxes, bottles, shirts, pencil, and containers).
First, people dispose of their plastic waste in a bin. Waste collecting trucks collect the trash and move it to recycle center. In the center, after sorting re-useable plastic manually, a considerable amount of bottles is compressed into blocks.
These blocks are then crushed in a crushing machine and after washing the crushed particles. These particles need to pass through a machine to make plastic pallets. These pallets are then heated to form a raw material and this material will further use to make plastic boxes, bottles, and other products that use plastic in production. In addition, this process repeats again and again to reuse plastic material.
I will point out three mistakes. If you want a complete edit please use my writing service.
For details about my writing service please refer to the link below:
https://www.ieltsanswers.com/writing-correction-ielts.html
1. There are too many details in the overall summary. “Overall, there are nine steps starting with bottles being thrown in the trash and ending with products being made from the recycled plastic.”
2. you could use more sequencing words: subsequently, next, after that
3
In additionThen, this process repeats again and again to reuse plastic material.The overall score seems around BAND 7
hey, there kindly give feedback and band score for my writing task 1 attempt.
The given charts depict the change in the percentage of households that owned electrical appliances (refrigerators, washing machines, and vacuum cleaners) and number of hours spent per week on housework like cleaning, preparing meals, and laundry over a time period of 1920 to 2019 in a country.
Overall, ownership of all three electrical appliances increased and this resulted decreased in a number of hours per week performing domestic chores.
In 1920, almost no one owned a refrigerator while 30 percent of people had vacuum cleaners and 40 percent had washing machines. In addition, these figures changed in a couple of decades and rose to 90 percent for refrigerators and 70 percent for the other 2 appliances.
In 1980, every household had a refrigerator and so the percentage rose to 100 and maintained that position. The vacuum cleaner was the second most appliance that every household had and then it rose to 100 percent in 2000 and maintained its position afterward. While washing machines went up around 75 percent in 2019 despite little fluctuation in 1980.
However, with an increase in the use of these appliances, time spent on housework per week decreased rapidly from 50 hours in 1920 to 20 hours in 1960 and it further plummeted to 10 hours in 2019.
I will point out three mistakes. If you want a complete edit please use my writing service.
For details about my writing service please refer to the link below:
https://www.ieltsanswers.com/writing-correction-ielts.html
1. resulted
decreasedin a decrease in a number of hours per week performing domestic chores.2. the second most popular appliance
3. went up to around 75 percent in 2019 despite a little fluctuation in 1980 [you can’t have a fluctuation in one year!]
Overall this seems about band seven
thanks..
16 test1 task1
I would like you to check my essay below and score it, please.
The bar chart illustrates earnings by exports in these four groups, and the table shows the rate of growth or decline in those categories in one country in both 2015 and 2016. Overall, both the earnings and the percentages of the four groups, Petroleum products, Engineered goods, Agricultural products, and Textiles, have increased, on the other hand, the value and percentage of Gems and jewelry have decreased slightly between 2015 and 2016.
Focusing on the rate of growth and decline, in Textiles, there is the biggest increase of 15.24%, lifted from about $25billions to $32billions, and the increase in Agricultural products is the smallest between 2015 and 2016, only 0.81%. In only Gems and jewelry, the earnings have slightly declined by approximately $2billions, about a 5.18% decrease in a year.
Examining the rate which each category accounts for, in this country, both in 2015 and 2016, Petroleum products can earn the most, but the category which can earn the least differs from Agricultural products to Textiles due to the huge growth in Textiles. The values of Petroleum products and Engineered goods consist of over 50% of all export earnings in this country in both 2015 and 2016.
I will point out three mistakes. If you want a complete edit please use my writing service.
For details about my writing service please refer to the link below:
https://www.ieltsanswers.com/writing-correction-ielts.html
1. do not capitals the categories “Textiles” = “textiles”
2. no “s” on billions: $25billions = $25billion
3. not enough figures given in the last paragraph
Overall 6.0
16 task 3 writing 1
The given graph illustrates the transformation of the southwest airport from now to next year.
Overall, the area will be extended after the development. Moreover, there will be more facilities for the visitors to use, thus people could travel to the gates by vehicles instead of on foot. The major change is there will be more gates to join the service.
Now, after entering the departures, we can see a check- in station on left and a café on right before going through the security and passport control. However, next year, the entrances of the departures will increase to two and a extra bag drop station will be added while the café will state next to the left hand side of the entrances. Moreover, after passing through the security, passengers could spend time on some new shops. As for the arrivals areas, the entrances will increase form one to two with an addition coffee shop, an ATM and car hire.
For the concourse, the total number of gates will expand from eight to eighteen. The automatic walkway will also change to the sky train.
I will point out three mistakes. If you want a complete edit please use my writing service.
For details about my writing service please refer to the link below:
https://www.ieltsanswers.com/writing-correction-ielts.html
1. check- in station on THE left
2. the café will [state] STAY next
3. could spend time [on] in some new shops
overall 6.5 [lots of minor errors]
Hey, can you please give me a quick feedback for my test 4 answer below? Thank you so much!
16 task 4 writing 1
The given illustration introduces the procedures of renewing reusable bottles.
Overall, there are nine steps in this cyclic process, including collection, sorting, dissection and reproduction.
First of all, the cycle starts after we put the plastic bottles into the recycling bin. A specific truck is then collected those bottles from every bin in the region. Afterward, workers in the recycling center divide the suitable bottle from the collection so as to clarify if it fit the standard for recycling.
As for those chosen bottles, they are compressed by a special machine and form a smaller cube and ready for crushing into small pieces, the next step is to remove dirty particles which consist in the plastic pieces. Next, the prepared recycling plastic then send to another crushing machine for the second division. After that, plastic pellets are ultimately produced which need to be heated as the raw resources. Finally, to the last stage, the raw materials are being manufactured to different products, for example, plastic bags, plastic boxes, clothes, and also plastic bottle. The used plastic bottle is then collected for the next cycle.
I will point out three mistakes. If you want a complete edit please use my writing service.
For details about my writing service please refer to the link below:
https://www.ieltsanswers.com/writing-correction-ielts.html
1. “we put” is informal ” and “we” includes you and i do not see YOU putting bottles in
after we put the plastic bottles into the recycling bin + “after plastic bottle are put” {PASSIVE}
2. A specific truck is then collected those bottles = “A truck is then collects those bottles”
3. dissection and reproduction doesn’t sound great “separated” “made into”
Overall 6.5
Please let me know my SCORE,
Task 01
The line charts above show the percentages of households owning washing machine, refrigerator and washing machine, and the amount of time spent per week doing the housework such as washing cloths, meal preparation and cleaning in one country between 1920 and 2019.
Here the ownership of electrical appliances shows an overall upward trend, meanwhile the hours spend doing housework show an overall downward trend.
In the early 1920’s most of the households owned a washing machine (40%), and the number of users using washing machine steadily increased until end of 1960. Even though, a slight decrease was observed from 1960 to 1980’s, the numbers seemed to recover and raised up to 75% by the end of 2019.
The ownership of refrigerators and vacuum cleaners show a similar upward tread from the beginning of 1940. By the end of year 2000 all the households in this country owned a refrigerator and a vacuum cleaner.
I will point out three mistakes. If you want a complete edit please use my writing service.
For details about my writing service please refer to the link below:
https://www.ieltsanswers.com/writing-correction-ielts.html
1. “The line charts
above” They are not above and will not be on your test paper.2. ” owning washing machine” = owning a washing machine
3. washing
clothsclothes4.
HereOverall, the ownership of electrical appliances shows anoverallupward trend, meanwhile the hoursspendspent doing housework show an overall downward trend.The line graphs illustrate the ownership of electrical appliances including washing machine, refrigerator and vacuum cleaner and the time duration in daily activities of washing clothes, preparing meals and cleaning over a century, since 1920 to 2019, in a nation.
Overall, the trend to own electrical appliances seems to be going uphill, however refrigerators outnumbered among other two. Similarly, time for household chores reduced in the number of hours per week significantly.
In the early 19th century, approximately every third of houses in the country had a vacuum cleaner and a washing machine. Initially both followed increasing fashion every twentieth year, vacuum cleaner maintained its growth until the 20th century reaching up to 100 percent. However washing machines could not stand in 1980 and fell to 60 percent. After that, it maintained its worth and reached back to 70 percent of households. In comparison, refrigerators started from zero in 1920 and demand rose over other appliances in a very short time. In 1960, every household had one, even after that it showed higher urge to own.
Furthermore, The time utilized by activities in house decreased significantly, that is an hour each year from 60 working hours in 1920 to forty hours in 1960, after that only trivial changes were noticed. In 2019, it reached over 10 hours.
I will point out three mistakes. If you want a complete edit please use my writing service.
For details about my writing service please refer to the link below:
https://www.ieltsanswers.com/writing-correction-ielts.html
1. “Going uphill” is not okay as it is informal and inappropriate in this context.
2. In the first sentence you need to add S to the appliances because there’s not just one. It’s washing machines and not washing machine.
3. You wrote ” however refrigerators ” but it should be “and refrigerators” … You’re adding another increasing item and so you should be using an additive conjunction and not a contrasting one like however
The diagram illustrates the current situation and future improvement plans for Southwest Airport.
Looking at an overall perspective, several new additions are to be introduced in the future where checking , walk ways, and gates are located.
As per the present situation, only two departure and arrival gates are present, and for that section, another arrival and departure gate will be added. In between the arrival-departure doors and the passport control sections, there are two sections that are mainly café and check-in. However, in the future, this area will be improved with new allocations that are bag drop, ATM, car hire area, and another café area.
As well as, in the future, the present eight gates with square-shaped gate areas are converted into 18 gates with Y-shaped gate areas. This expansion will improve the Sky Train walk way.There will be a shop area in between the passport control area and the gate area in the upcoming developed airport.
However, security and customer passport control areas remain unchanged.
I will point out three mistakes. If you want a complete edit please use my writing service.
For details about my writing service please refer to the link below:
https://www.ieltsanswers.com/writing-correction-ielts.html
1. “Looking at an overall perspective” = “Overall,”
2. The overall summary is weak and should focus on the airport being BIGGER and having MORE facilities
3. “new allocations” = “new facilities”
4. “gate areas are converted into 18 gates” needs to be WILL BE converted
the score is about 6.5
Than You for your support
Thankyou for corrections. Can you please score it?
Overall 6.0-6.5
TA and CC may be as high as 7
LR and GRA 6
Lots of errors with vocabulary…”19th century” is another;
The 19th (nineteenth) century began on 1 January 1801 (MDCCCI), and ended on 31 December 1900
Thanks a lot for corrections
The chart above provides information on the change in the use of washing machines, refrigerators, and vacuum cleaners between 1920 and 2020.
Overall, all the electrical appliances experienced an upward trend regardless of some fluctuations in the washing machines’ ownership rates, while the time spent on housework per week decreased gradually throughout the period.
In 1920 the ownership rate of refrigerators was almost zero percent while the rates of washing machines and vacuum cleaners were nearly 40% and 30% respectively. Then, the refrigerator’s rate increased sharply to about 50%, exceeding the vacuum cleaner’s rate in 1940. In the meantime, the percentages of both washing machines and vacuum cleaners increased by about 10%. In 1960 the sharp uptrend of the refrigerator’s rate continued and reached about 90%, leaving behind the washing machine’s rate. In the same year, the rate of vacuum cleaners caught up with the washing machines’ rate by reaching about 70%. In 1980, the percentage of refrigerators reached almost 100% and remained steady until the end of the period. The vacuum cleaner’s rate rose to about 90% in 1980, then reached nearly 100% in 2000 and remained steady until the end of the period. However, the percentage of washing machines decreased by around 5% in 1980 but showed a gradual increase to about 70% in 2000 and rose to about 75% in 2019.
In 1920, the number of hours spent on housework per week was 50, then it experienced a gradual decrease during the next two periods, falling to about 35% in 1940 and diving to almost 20% in 1960. In 1980, the time declined by around 5%, and remained steady for the next year, and hitting a low-point of about 10% in 201
1. “leaving behind the washing machine’s rate” = overtaking
2. rate is used a lot and be phrase as percentage and proportion
After 2 minute check I think this is probably a 7.5
For a comprehensive 20 minute check with full grade and explanation see here: https://www.ieltsanswers.com/writing-correction-ielts.html
The charts illustrate the changes in the usage of washing machines, refrigerators and vacuum cleaners and the time allocated for housework in a particular country from 1920 to 2019. The changes and the time spent are measured in percentages and hours per week respectively.
Overall, using electrical equipment for housework is becoming popular with refrigerator and vacuum cleaner being at the peak and as a result the time consumed for housework is reduced over the period.
The demand for washing machines had seen a slower increase from 40% to around 75% over the period with a slight decline from 1960 to 1980. Comparatively, the usage of vacuum cleaners had significantly increased from 30% to 100% by 2000, overtaking vacuum cleaners in 1960, and remained constant after 2000. In addition, the refrigerators, starting from zero level in 1920, had seen a rapid increase in popularity and reached 100% in 1980 by overtaking the other two equipment and remained constant thereafter.
As a result, the time spent on housework had significantly reduced from 50 hours per week to around 15 hours by 1980 and remained same until 2000, which had then declined to around 10 hours in 2019.
I will give you three free points on your writing. For a full correction with scores for all four criteria by an IELTS examiner please see this link: https://www.ieltsanswers.com/writing-correction-ielts.html
overall score:7.5
1: For your overall summary “being at the peak”doesn’t really make sense and you just need to make a comment that all types of appliances have increased and the amount of time spent on housework has decreased
2: ” washing machines had seen a slower increase from 40%” slower than what? You need to make this clear “slower increase than other categories”
3: “had significantly reduced” should be “has”significantly reduced
Depicted on the map is the reconstruction of the airport in the next year; the changes and progress of the airport can clearly be noted on the illustration.
Overall, it can be immediately seen that the airport has been developed to accommodate more travellers. The most noticeable change is the expansion and additional of gates, while the security, passport control and customs remained unchanged.
The airport now, has one entrance each for departures and arrivals. On the departures side, there is a Check-in on the North- western side of the hall opposite to the café. On the next level of the building is the security and passport control; after which there is an open space before reaching the walkway which has 8 gates. On the arrivals side, there are two open areas before and after reaching the passport control and the customs.
It is projected that on the coming year, there will be additional entrances for both departures and arrivals. The café will be transferred on the left side of the entrance and bag drop has been added beside the café where in the Check-in will be move to the right side of the departure area. Security, passport control and customs remained unchanged in both area of the airport while shop will be added on the departure area before the gates. The walkway will be upgraded into sky train and the gates will be expanded with additional 10 more gates. On the arrival area, additional café and ATM will be seen on the right side along with a car park which will be situated on the right lower corner of the airport.
I will give you three free points on your writing. For a full correction with scores for all four criteria by an IELTS examiner please see this link: https://www.ieltsanswers.com/writing-correction-ielts.html
overall score:7.5
1: 272 words is too long and you will not finish on time
2: do not give opinions “it can be immediately seen”
3: reduce words with the structure below:
introduction
changes to the front
changes to the back
Thank you Mike.. well noted on your comment🙏🏻
Depicted on the interchange graphs are the households with electrical appliances percentage as well as the hours of housework per week, per household in one Nation in two timestamps 1920- 2019. Percentage and hours are utilized as the unit of measurement on the ensuing paragraph
Overall, vacuum cleaner and refrigerator has the highest percentage of electrical usage from 1920 until 2019; while the housework per household was has high in 1920 and became least on the last year of the said.
Looking at the percentage of electrical appliances practices, refrigerator had a significant increased in the year 1920 to 1960 from 0% to 90% and reached the usage to 100% from 1980 which remained unchanged until 2000. While washing machine which was started from 40% in 1920 had climbed up steadily in 1960 with 70% followed by a minimal dropped of 5% in the year 1980 and moved slowly to 75% in the year 2019. However, vacuum cleaner had inclined steadily from 1920 with 30% to 100% usage in the year 2000 and maintained with the same % in the year 2019.
On the hours of housework per household, most of the people spent a lot of hours in washing clothes, preparing meals and cleaning in the year 1920 with 50 hours per week, but in the year 1960 it went down to 20% mainly because of the introduction of new appliances. In 1980 there was a minute decline to 15 hours and remained unchanged until the year 2000. Lastly, in 2019 it dropped to 10 hours.
I will give you 3 free points on your writing. For a full correction with scores for all 4 criteria by an IELTS examiner please see this link: https://www.ieltsanswers.com/writing-correction-ielts.html
overall score: 7.5 [6 for TA due to giving opinions
1: it is about ownership and “electrical usage”
2: years and not year ” in the year 1920 to 1960 ”
3: you should just report the data and not give opinions or guess reasons “went down to 20% mainly because of the introduction of new appliances.”
Depicted on the illustration is the process of how sugar is made from sugar cane, along with the stages encompassing the collection to generation.
Overall, there are 7 stages entailing how the production of sugar, the nascence is from the growing of the sugar cane and completes with the drying and cooling of sugar.
To begin with, is to wait for 12-18 months until the sugarcane is fully grown, followed by harvesting which can be done in two ways; either by the means of tractor machine or by ingathering it manually. After which it will be place to a machine, for the sugar cane to be crushed in order to extract the juice. Then the extracted juice will be filtered with lime juice to make it more purified.
The purified juice, will then place to an Evaporator which is heated to make the juice becomes syrup. After that, it will be place inside a centrifuge to separate the sugar crystals from the syrup. Finally, it will be place to a large container for the drying and cooling process of the sugar.
I will give you three free points on your writing. For a full correction with scores for all four criteria by an IELTS examiner please see this link: https://www.ieltsanswers.com/writing-correction-ielts.html
overall score: 7
1: seven stages “7 stages”
2: the first step is to “To begin with, is to wait for 12-18 months”
3: placed in an evaporator “place to an Evaporator “
The line charts illustrate the proportion of households changing their electrical products ownership and the number of hours per week spent on doing households work in a country from 1920 to 2019.
Overall, all three electrical appliances’ ownership increased steadily over the years. Vacuum cleaner experienced rapid growth compared to the other two products and the number of hours of housework decreased gradually.
According to the line graph, In 1920 vacuum cleaner users was almost 0% and refrigerator and washing machine user was 30% and 40% respectively. Afterward vacuum cleaner users increased dramatically to about 52% in 1940 and climb up significantly to 90% in 1960 then from 1980 to 2019 it rose to 100% ownership.
On the other hand, Refrigerators users jump to 40% in the year 1940. Then refrigerator shows a continuous increase to 100% in 2000 and remains stable until 2019. The washing machine had some fluctuation over the year, In 1940 the number of washing machine users increased to 60% and subsequently rose to 70% in 1960 then it declined slightly to 65% in 1980 then upward again to 72% in 2019.
In contrast, the number of hours of housework declined sharly 50% to about 10% between 1920 and 2019 respectively due to the new home appliances innovation.
Note that if you want a complete edit you can use my service on the link below.
https://www.ieltsanswers.com/writing-correction-ielts.html
For free checks I’m only going to give you a few quick points and an estimated score:
1. “Vacuum cleaner experienced ” vacuum cleaners experienced… It’s not just one vacuum cleaner!
2. “Vacuum cleaner users”… It’s the proportion of houses with vacuum cleaners. Each house could have a number of users.
3. I don’t know why you have two paragraphs for the home appliances and I suggest you just put them in one paragraph
4. It’s risky to say that housework declined due to the new home appliances… This could be considered an opinion and your score for task response might be cut.
Overall = seven
Hey can you review my essay.
The charts summarises the amount of time it takes to complete house work in a household and the difference in the electrical appliances ownership in a country between 1920 and 2019.
There are 3 electrical appliance ownerships given in the chart. The general curve is rising but that of a refrigerator is most steep . Between 1920 – 1980 this increases from a 0 to 100 and then becomes stable from 1980 to 2019.
However the curve for a vacuum cleaner has a steady rise compared to the refrigerator. It increases from 30% in 1920 to 100% in 2000. Though similar to the refrigerator curve it also platues but from 2000 to 2019.
Moreover the curve for a washing machine shows the most fluctuations .it increases from 40% in 1920 to 70% in 1960 and then dips in 1980 to 65% but then rises again to around 75% in 2019. Thus accordingly the ownership of a washing machine has seen less significant change as compared to other appliances.
As for the time taken to complete the household work per week has decreased more drastically from 50hrs per week in 1920 to 20 hrs in 1960. After this there is a less remarkable downward slope of just 10hrs between 1960 and 2019
Note that if you want a complete edit you can use my service on the link below.
https://www.ieltsanswers.com/writing-correction-ielts.html
For free checks I’m only going to give you a few quick points and an estimated score:
1. house work should be written as one word: housework
2. “that of a refrigerator is most steep” = “that of refrigeratorS is THE most steep”
3. The following phrase needs to make it clear it is % “this increases from a 0 to 100”
4. No clear overall summary
OVERALL SCORE: 6.5
The two line charts illustrates the percentages of households with electrical appliances and the number of hours of housework done per week in each household in the period of 1920-2019
Overall, we can notice that the percentage of households with refrigerators and vacuum cleaners have steadily risen while percentages households with washing machines fluctuated, ending with an overall increase in adoption on all three. With this, it is observed that the numbers of hours spent on housework per household has dropped during the period.
All three appliances, washing machines, refrigerators and vacuum cleaners saw an increase in adoption between 1920 and 1960, with refrigerators drastically increasing from 0% of households to 90% and the other two reaching the same 70% adoption mark. When 1980 rolls around, washing machines saw about a 10% drop of usage while refrigerators and vacuum cleaners continue becoming more popular, with refrigerators being used in every household. Then in the period 2000-2019 Vacuum cleaners reached 100% adoption rate, refrigerators maintaining usage on all households and washing machines slightly increasing from 70% of households having one up to about 85%.
The amount of hours spent on housework per week saw a continuous decline of about 35 hours between 1920-1980, in 1980 it stayed relatively flat until the year 2000 when it continued to decline for another approximately 5 hours.
Note that if you want a complete edit you can use my service on the link below.
https://www.ieltsanswers.com/writing-correction-ielts.html
For free checks I’m only going to give you three pointers and an estimated score:
1. For the overall summary just mention the overall trend. For washing machines that increased and don’t bother mentioning the fluctuation.
2. “rolls” needs to be past tense “rolled around” … This also seems a bit informal
3. “35 hours between 1920-1980, THEN in 1980”
Overall score = 7.5 [one of the reasons why you wouldn’t get paid for task achievement is that you never told me the starting number four housework per week… You tell me what the decliner but you don’t tell me the figure that it declined from so I have absolutely no idea of what it was in 1920]
IELTS ACADEMIC 16 – TEST 1, WRITING TASK 1 – The charts below show the changes in ownership of electrical appliances and amount of time spent doing housework and households in one country between 1920 and 2019.
Could you please give me a quick feedback of my answer below with the band score if possible?
Thank you.
Graph 1 shows the percentage of households with Washing Machines, Refrigerators and Vacuum Cleaners from the year 1920 to 2019. The use of refrigerators was 0 in the year 1920, while the use of vacuum cleaners and washing machines was 20% and 30% respectively. The graph of refrigerators took a peek in the next 20 years, i.e., the percentage use of washing machines in 1040 was 55%. This usage kept increasing till it reached a peak of 100% in the year 1980. The use of washing machines has been at a constant peak since. Similarly, the use of washing machines also saw a relative hike in usage from 30% in 1920 to its peak in the year 2000. Vacuum cleaners on the other hand had an unstable growth. There was a rise from the year 1920 to 1960 when the usage hit 70% following which there was a dip in usage in the next 20 years with a usage of 65%. However, the usage of vacuum cleaners rose again to 75% in the year 2019.
Graph 2 shows the number of house hours per week per household from the year 1920 to 2019. In the year 1920, the hours of housework per work was at its maximum at 50% household. However, over the years this number dips drastically and reached 10% in the year 2019. We can see that the trend has declined by 40% in a period of 99 years.
Overall, we can see that the usage of electrical appliances has grown over the period of observation while the number of houses doing their household work per week has declined. We can conclude that a rise in the use of electronic applications has resulted in a relative decline in the weekly household work per week.
overall about 6.5
1. You can’t capitalise the appliances because they are not proper nouns: “Washing Machines” = washing machines
2. You must not give any personal opinions and you gave one at the end about the increase in appliances leading to the decline in housework…. There could be other possible reasons such as people being lazier
3: “electronic applications” sounds like a browser on a computer or something… You mean appliances
4. This task is not structured well. I suggest:
Paragraph 1: introduce what the task is about and put your overall summary here and not at the end
paragraph 2: chart 1
paragraph 3: chart 2
We can conclude that a rise in the use of electronic applications has resulted in a relative decline in the weekly household work per week.
Hello, I checked your model answer of task 1 from Cambridge15 test 4(Anthropology pie chart).
Could you please give me a quick feedback of my answer below with the band score if possible?
The chart illustrates the occupation pattern of graduates who majored in Anthropology from a certain university and the table depicts their incomes five years after they started working. Overall, full-time work accounted for the largest proportion while people doing both postgrad study part-time work were the least. In terms of income, people who work for the government sector earned the most, followed by freelance consultants and private companies.
Regarding the employment pattern of anthropology graduates, more than half of them were working as full-time employees comprising the biggest slice. Part-time work accounted for 15% and 12% did not have their jobs at this point. Graduates who do their postgrad study and people who did not answer were 8%, respectively, while people balancing postgrad study and part-time occupied the smallest segment with 5%.
When it comes to salaries after 5 years, even though the number of people who received less than 75,000$ was the same for freelance consultants and the government sector as 5% and 15%, there was a slight difference once the salary range gets higher. Half of the graduates working in the government sector earned more than $100,000 which was 10% more than that of freelance consultants. However, 45% of graduates from private corporations earned less than 75,000$ and only 30% got more than $100,000 which was the least among the three types.
Hi, thank you so much for the comment above.
It helped me a lot!
I would like to kindly ask for another feedback which is the answer of test 2.
Thank you so much.
The diagram depicts the necessary steps that the sugar canes should undergo to be re-created as sugar. Overall, the whole procedure consists of 7 stages which starts with growing sugar canes and ending up with drying and cooling sugar.
First of all, it takes about 1 year or extra half year more to grow sugar canes completely. Once they are fully grown, they are harvested mechanically by tractor or manually by farmers. After that, they are put into the crushing machine to be chopped down in small pieces, and eventually turn into the liquid form. Next, this juice then undergoes purifying stage using limestone filter and distilled liquid here is transferred to the evaporator which is heated with the fire. Once the watery juice is changed into a stickier form in this step, a centrifuge is then used to divide this syrup with sugar segments. Finally, when separated sugar crystals are fully dried and cooled with fresh air, they are ready to be consumed as sugar that we are all aware of.
1. which starts with growing sugar canes and [ending] ENDS up with drying and cooling sugar
2. to be [re-created as] TURNED INTO sugar
3. [it takes 1 year or extra half year] it takes 1 to 1.5 years
I really appreciate your prompt reply!
Could you also let me know what would be the score for this answer?
Also, I would like to ask where can I put my task 2 answers and get some quick feedback from you.
I tried to find one, but I was not able to…
Thank you so much!
For essay correction please use my service here:
https://www.ieltsanswers.com/writing-correction-ielts.html
Mike, I really appreciate your prompt reply.
I would like to ask what would be the band score for the answer above.
(I already left this comment, but I’m writing it again since I could not find mine…)
It seems like it’s likely a seven or 7.5
Grammar is no more than seven due to frequent errors with articles and a couple of other mistakes
Hi, could you please give me a quick feedback for my answer below? Thank you so much!
The two charts illustrate the households which possess electrical machines percentage-wise and how the number of hours people spend on their house chores per week changed in the years 1920 and 2019.
Overall, households with washing appliances, refrigerators, and vacuum machines increased throughout the period and the amount of time spent on housework gradually decreased along with this.
The percentage of houses that had a refrigerator in 1920 was the lowest among the three appliances, which was close to 0, however, dramatically increased in 1940 to 55 percent. This huge surge was repeated once again in 1960 reaching 90 percent. From 1980 every household had a refrigerator and it continued until 2019.
In the case of the vacuum machine, 30 percent of households had it even in 1920. The graph showed a gradual upward trend until it reached 90 percent in 1980, outracing the graph of the washing machine after 1960. Once it reached 100 percent in 2000, it remained the same until 2019.
The percentage of households that owned a washing machine was the highest in 1920 with 40 percent. Even though the percentage grew up to 70 percent by 1960, it started to fluctuate from then to 2000 and remained the lowest with 75 percent at the end of the period despite the slight growth of 5 percent.
While the number of time spent on house chores every week was 50 hours at the beginning of the period, it showed a downward trend throughout the period, reaching about 10 hours at the end of it which is almost one and a fifth of that was 100 years ago.
Hi, can you please give me a feedback for my test 1 answer below? Thank you so much!
The two charts illustrate the households which possess electrical machines percentage-wise and how the number of hours people spend on their house chores per week changed in the years 1920 and 2019.
Overall, households with washing appliances, refrigerators, and vacuum machines increased throughout the period and the amount of time spent on housework gradually decreased along with this.
The percentage of houses that had a refrigerator in 1920 was the lowest among the three appliances, which was close to 0, however, dramatically increased in 1940 to 55 percent. This huge surge was repeated once again in 1960 reaching 90 percent. From 1980 every household had a refrigerator and it continued until 2019.
In the case of the vacuum machine, 30 percent of households had it even in 1920. The graph showed a gradual upward trend until it reached 90 percent in 1980, outracing the graph of the washing machine after 1960. Once it reached 100 percent in 2000, it remained the same until 2019.
The percentage of households that owned a washing machine was the highest in 1920 with 40 percent. Even though the percentage grew up to 70 percent by 1960, it started to fluctuate from then to 2000 and remained the lowest with 75 percent at the end of the period despite the slight growth of 5 percent.
While the number of time spent on house chores every week was 50 hours at the beginning of the period, it showed a downward trend throughout the period, reaching about 10 hours at the end of it which is almost one and a fifth of that was 100 years ago.
1. “in the years 1920 and 2019” means just in these two years and instead you should write “from 1920 to 2019”
2. “however, dramatically increased ” you need a pronoun “however, it dramatically increased”
3. “a fifth of that was 100 years ago” = “a fifth of what it was”
3 suggestions for you. I think your score is likely to be quite high around 7 or 7.5; but I’ve just had a quick glance at it
If you want complete feedback please check out my writing correction service:
https://www.ieltsanswers.com/writing-correction-ielts.html
Hi… appreciate your feedback on the sample answer. What would be the band score for this kind of answer
The graph depicts the percentage of households that owned electrical appliances from 1920 to 2019. And the number of hours spent on household work for a week by a person for the given period.
In general, It indicates that the ownership of electrical appliances has steadily increased over the period 1920 – 2019. Further, as the acquisition rate increases, the number of hours that a person spends on household work has gradually reduced to the lowest as 10 hours per week.
Mainly all equipment shows growth in ownership. More importantly, vacuum cleaner and refrigerator has become the most commonly owned item (2019 – 100%), whereas those were available to fewer families in the early 90s at 0% and 30% respectively. In contrast, the washing machine which was the highest became the least owned by 2019.
Ownership of refrigerators and vacuum cleaners showed steady growth until 1980, there onwards no significant change in acquisition rate. Washing machine growth was marginal from 1920 to 2019 ranging between 40% to 75%
Percentage of households shows an upward trend while time spent on household work has sharply decreased to lowest as 10 hours per week.
Overall score: 6.5
Task achievement: 6; there is not an adequate coverage of the data
cohesion and coherence 6: I don’t understand the purpose of paragraph 2 and three and why this data is separated I suggest combining paragraph 2 and three so that you have the following
introduction including overall summary [combine paragraph 1 and two]
household appliances [combine paragraph 3 and four]
house work…. Write more about this!
I haven’t really thought much about vocabulary and grammar so let’s say seven and then your overall 6.5
The given line graphs provides information on the possession of electrical devices and the proportion of time spent on households chores in a country during a century between 1920-2019.
It can be clearly seen that washing machine dominated the household possession at the beginning compared with refrigerator and vacuum clear; however, at the end of century this trend has been reversed. Time spent on daily housework has also been reduced over the period.
Households owned the washing 10% more than the refrigerator in 1920, and in 1940 60% homes owned washing machine while incase of refrigerator and vacuum it was almost 50% and 55 % respectively. From 1960 possession of vacuum and refrigerator had increased to 100%, while the washing machine observed a less growth and between 1960-1980 a 5 % decrease in washing machine was noted and it then reached around 75% in 2000. 50 working hours were spent during 1920 on daily household chores while it dramatically decreased to almost 35 % in 1940 and then to 20 % 1960. A slight decrease of almost 10 % had been observed between 1960-2000.
1. The given line graphs [provides] provide
2. [washing machine dominated] washing machines dominated
3. vacuum [clear] cleaners
these are the first three mistakes I noticed if you want to have a full check of your writing I have a paid service for this here: https://www.ieltsanswers.com/writing-correction-ielts.html
Hello I really need your feedback. Please mention the band with feedbacks to improve if possible.
The provided diagram illustrates the various stages of how a plastic bottles are recycled.
Overall, it is evident from the diagram that the recycling goes through nine stages. The first step is throwing the waste into their respective container and the last is to produce the end products.
Firstly, the waste material is thrown into the trash from where it is taken to the recycling center in a truck. Then, in the recycling center, the bottles are sorted by hands where the good ones are further taken to another stage whilst the damaged bottles are rejected.
Initially, the selected bottles are compressed into blocks and are crushed by the crusher. The crushed particles are further washed in a container. After being washed, the particles are sent into a machine to produce plastic pellets. The pellets are then heated to form raw materials. Lastly, the raw materials are used to produce the end products.
looks good enough for band 7.5
1. “sorted by [hands] hand”
2. “the good ones [are further taken] to another stage” … “MOVE ON to another stage”
3. with this task there is an arrow from the least to first stage and this should be mentioned in your report
Hey, can u give a quick feedback as well? Please mention the band this can achieve according to you as well if u have time. Thank you so very much !!
test 1 task 1
The two charts illustrate the percentage of households with different electrical appliances and the number of hours spend on the housework per week from 1920 to 2019.
Overall, more than half of the households in the country were using all three appliances around 1940. After that, although there was a gradual increase in the use of vacuum cleaners and refrigerators, the number of washing machines still fluctuated. There was a significant decrease in the number of hours spent on household during the first 40 years of the period.
At the beginning of the period in 1920, nobody had refrigerators in their households, meanwhile, around 30% – 40% of households had vacuum cleaners and washing machines. The ownership of refrigerators rose drastically and in the next twenty years, all the appliances were in more than 50% of households. Later on, the number of refrigerators and vacuum cleaners grew gradually, and on the contrary, owners of washing machines decrease for about 10 years before gradually increasing themselves again. In 1980 and 2000, all the households had refrigerators and vacuum cleaners respectively.
In the case of time spent on housework, it fell drastically, almost less than half, in the first forty years. After that, there was a stable decline in the number of hours invested in housework.
1. the overall summary was not great. It’s best to focus on the overall trends = all appliances increased and housework decreased
2. ” number of hours spend” SPENT past tense needed
3. hours spent on household ” hours spent on household TASKS”
band score around 6.5 to 7
https://www.ieltsanswers.com/writing-correction-ielts.html
Could you give feedback? thanks a lot.
Two graphs show that the percentages of people having electric devices and the number of hours weekly that are spent on housework like washing clothes, preparing meals, and cleaning from 1920 to 2019.
Overall, the total percentage of people in all devices had an increasing trend during the period. According to, weekly time-consuming in housework for a person decreased proportionally within the same time period.
In 1920, houses including a washing machine (%40) and vacuum cleaner (%30) were below a half, although refrigerators hadn’t yet existed in any house. However, all houses in 1980 included a refrigerator, nine in ten houses had a vacuum cleaner. The figure for the washing machine was just above three-fifths in 1980. From 1980 to 2019, the vacuum cleaner and refrigerator could be found in any house and also the ratio of houses having washing machines reached to almost %70.
Housework time had a gradually decline year by year thanks to three electrical appliances. In 1920, hours of housework weekly per person were 50, while that of 2019 was only 10 hours.
1. number percentage 40%
2. [According to] In addition,
3. “and” is needed after the 2nd comma: However, all houses in 1980 included a refrigerator, nine in ten houses had a vacuum cleaner
https://www.ieltsanswers.com/writing-correction-ielts.html
Hey, can you please give me a quick feedback for my test 1 answer below? Thank you so much!
The line graphs illustrate the possession rates of three types of electrical appliances in households in a given country from 1920 to 2019 and the resulting time on housework per week.
Overall, all electrical appliances apparently became more popular, with the biggest increase recorded in the percentage of households with a refrigerator. The total time spent on housework, in contrast, declined steadily and dramatically over the period.
It can be seen that the figures for ownership of washing machines and vacuum cleaners followed similar upward patterns in the first 40 years, beginning at 40% and 30% in 1920 respectively. However, the proportion for the former then fluctuated around 70% while that for the latter continued to rise gradually, reached 100% by 2000 and leveled out until the end of the time researched. Throughout the period, refrigerators witnessed the most significant rise, whose figures started at just over 0% in 1920 and had remained the highest since 1940.
Time spent on washing clothes, preparing meals, and cleaning plummeted from 50 hours a week in 1920 to under half this amount in 1960. After that, the decline was more steady, finally ending the period at slightly above 10 hours in 2019.
Looks great around a 7.5-8
“whose” for people rather than household appliances.
I have a correction service to give more detailed feedback but if you only need a seven I don’t think you need it
( part 1 corrected)
The two line graphs have the following data, the first one represents, the percentage of households owning various electrical gadgets between 1920 and 2019. And the second one depict number of hours of housework per week between 1920 and 2019.
Starting with washing machines, about 40% of households owned it in 1920 making it the highest owned appliance in that year. Then, in 1960 it rose to 70% of households that owned it followed by a small dip in 1980 and then returning to 70% in 2000 and finally followed by a bit rise to 75% in 2019.
Refrigerator had most significant growth in the households, from 0% in 1920 to about 100% in 1980 and the percentage remained 100% in 2000 and 2019, making it the highest category of appliances to be available in the households along with the vacuum cleaner. Lastly, vacuum cleaner held a 30% of share in 1920 followed by steep rise to 100% of households owning it and percentage remained 100% in 2019.
As per graph number two, the number of hours of housework per week fell from 50 hours per week in 1920 to about 11 hours of work per week in 2019.
Overall, Refrigerator and Vacuum cleaner, saw the highest boost in ownership from 1920 to 2019. As a result, the increase in appliances in households decreased the hours of work per week.
The two line graphs have the following data, the first one represents, the percentage of households owning various electrical gadgets between 1920 and 2019. And the second one depict number of hours of housework per week between
1. Paragraphs 2 and three could be merged together because they will about the first graph and then you
Would be about the second graph
2. Avoid giving an opinion on the overall summary… Just state that housework decreased without saying it’s a result of the appliances
3. The first two sentences of the report need to be merged together
This is just some really quick feedback due to time limitations. I give full feedback with my writing correction service:
https://www.ieltsanswers.com/writing-correction-ielts.html
The following graphs illustrate the figure of people owning electronics and how much time they spend cleaning their house in one paticular country during 100-year period.
The usage of vacuums and fridges have increased in years between 1920 and 2019. In 1920, there were almost zero percent of people who had refrigerator ,while all of the citizens have them in recent years. Also the percentage of houseowners who have vacuum cleaner have gone up by 70% from 30% to 100%. The number of owners that own washing machine have climbed by 35%, however there was a slight drop in 1960 to 1980 by 5%.
Neverthless, the amount of time they spend doing households are went down during a century. People used to spend 50 hours per week doing houseworks, whilst that number fell to approximately 10 hours per week.
To sum up, the use of elecrical appliences rose mainly, at the same time the time of doing households decreased.
For a complete edit and feedback : https://www.ieltsanswers.com/writing-correction-ielts.html
1. for the summary you should be mentioning that the use of all electrical appliances rose [“Rose mainly” suggests that some didn’t!]
2. You covered start and end numbers well but you didn’t give many of the little numbers
3. Housework, like all other types of work, is uncountable
The line charts illustrate the percentage of electrical appliances use such as washing machine, refrigerator and vacuum cleaner in houses in a particular country between 1920 to 2019 and the time consumed in doing activities like washing clothes, preparing meals and cleaning in hours per week.
Overall, all the electrical appliances percentage increased in the given period whereas the time used for housework reduced.
The highest percentage in 1920 was recorded in washing machine which was 40% and the second largest was vacuum cleaner that recorded 30%. The lowest percentage was in refrigerator which was almost zero. The flow of owning washing machine increased gradually up to 70% in next 40 years. Then it showed a slight drop of 5% in 1980. The gradual increment of the washing machine use again rose up to 2019 which granted 75%. The refrigerator percentage increased significantly till 2000, that granted the peak of it 100% that remained in a plateau for the end of the period. Though there was no ownership recorded for vacuum cleaners it rose sharply for the next 40 years, that illustrate the highest percentage among all three appliances (90%). It increased extra 10% in 1980 and remained stable for the next 40 years.
The time consumed for housework was highest in 1920, which was 50 hours per week. Then it decreased gradually up to 20 hours in 1960. It merely dropped in more 5 hours when reaching 1980 and remained same for next 20 years till it dropped for the lowest in 2019 as only 10 hours.
At the moment time doesn’t permit me giving you free feedback on this.
You have to use my writing correction service if you want my feedback:
https://www.ieltsanswers.com/writing-correction-ielts.html
The following diagram illustrates the procedure of recycling plastic bottles in 9 ways. To begin with, people have thrown some plastic bottles in the dustbin and those bottes have been taken by container to the recycling centre for sorting. After that we can see that those plastic bottles have been compressed into blocks and it has been sent for crushing as well.Furthermore those crushed plastics have been taken to the washing area. After completion of cleaning, it has been sent for producing plastic pellets. Similarly, those pellets have been heated to make raw materials. In addition it becomes raw materials again and it can be used for making anything like bottles, clothes, pencils and so on. Therefore, we can see the proper usage of wasted things. How we can recycle everything that we use in our daily life.
Note that I have a paid correction service with feedback on the four grading criteria https://www.ieltsanswers.com/writing-correction-ielts.html. Here’s some quick comments:
1. under 150 words -1 off task achievement
2. no overall summary = maximum of five for task achievement
3. given one and two above you have 4 for the task achievement!
4. No paragraphs = low score for cohesion and coherence
5. I don’t understand the purpose of your last sentence
Test 2: Task 1
The diagram illustrates the process of making sugar from the source sugar cane in seven steps. The primary step is growing sugar canes which takes 12 to 18 months of time.
The next step involves harvesting the sugarcanes after their growth. This is done by cutting of sugarcanes and putting them in trucks. Subsequently, the collected sugarcanes is crushed and a juice is formed. This is carried out by a machine. This juice then goes through a purification process which essentially involves limestone filter. After the juice is purified, the juice is heated in a evaporator whose function is to reduce the juice to syrup.
After obtaining syrup, the next step focusses on seperating crystals from syrup which is called a entrifugal process. The final step of this transformation from suagr cane to sugar is drying and cooling of the obtained substance and finally obtaining the intended product which is sugar.
1. You do not have a valid overall summary so you cannot get above 5 for task achievement. With a process diagram, the overall summary can consist of
the number of steps, ingredients used, pieces of equipment used… For this one, I will use the number of steps. “Overall this process involves seven steps starting with growing sugarcane and ending with drying and cooling sugar.
2. Sugarcane is uncountable like most crops
3. I have an editing service if you want comprehensive edit: https://www.ieltsanswers.com/writing-correction-ielts.html
Could you provide a sample answer to test 2 task1 please.
Sure, I am really keen to do this I just need to get some spare time.
Hi, kindly give me a score and corrections
The diagram illustrates how sugarcane is processed to produce sugar.
Overall, the process involves several stages that raw sugarcane has to pass through which include: planting, harvesting, crushing, purification, evaporation, drying and cooling to achieve the end product which is sugar.
First of all, it take approximately 1 to 1.5 years for sugarcane to mature before harvesting which can be done manually or by use of modern harvester trucks saving time.
This is followed by crushing of the canes to produce juice that goes through purification in a limestone filter. Heat is then used to convert the juice into syrup in an evaporator.
The syrup is then passed through a centrifuge where the sugar is separated from crystals and other impurities.
The end product is then collected in large containers where it is left for a period of time to dry and cool.
I will give you three free points on your writing. For a full correction with scores for all four criteria by an IELTS examiner please see this link: https://www.ieltsanswers.com/writing-correction-ielts.html
overall score:6.5
1: 143 words does not meet the requirement of a minimum of 150 words and so your score for task achievement gets lowered by a band and all other criteria will be negatively affected by this = expect a low score!
2: the overall summary should state how many stages
3: I don’t like how each step is a paragraph! You should look at some of my model answer is to see how to write in paragraphs:
https://www.ieltsanswers.com/ielts-writing-model-answers-band-9.html
please give a model answer to test 1 task 1
Sure, it’s on my urgent to do list.
The diagram illustrates the most important seven stages of producing Suger from Suger cane.
Overall the process begins with the growing of Suger cane during one and half year and finish when Suger is ready to use and sell.
Firstly The Suger cane plant in growing area. It gets 12_ 18 months for growing. After finishing planting of cane have to be cut down all plants by human or using machine. However finishing collect harvesting that clan througly before begin process.
The begin process of sugar making progress insert some what of sugar canes to the machine for bring sugar juice via crushing. Then the juice of sugar going to be purify through the limestone filter for separate other particles from it. After purify juice collect to the large boiler and start to heat untill became a syrup through the evaporation. What nice method. Before end of stage syrup of sugar centrifuge using machine for separate crystals of Suger from thick syrup.Finàlly end of this process hav3 to be dry the crystal and after cool using method. As a results of those mechanism ready to use Suger after the amazing seven steps of process.
The report provides a clear overview of the process of producing sugar from sugar cane and includes a diagram to help illustrate the information. However, there are several grammatical and spelling errors in the report, such as “Suger” should be “Sugar”, “finish” should be “finishes”, “clan” should be “clean”, “progress” should be “process”, “insert” should be “put”, “via” should be “by”, “purify” should be “purified”, “collect” should be “collected”, “heat” should be “heated”, “What nice method” should be “Which is a nice method”, “Finàlly” should be “Finally”, “hav3” should be “have”, “As a results” should be “As a result”, “mechanism” should be “method”.
In terms of the IELTS criteria, the report may receive a score of around 5 for Task Achievement, Coherence and Cohesion, and Lexical Resource. The report may receive a score of around 3 for Grammar Range and Accuracy.
The diagram shown illustrates the seven stages involved in the production of sugar from sugar cane.
The primary stage involves planting and growing sugar canes which takes about 12-18 months approximately. The second step is harvesting the sugar canes which can be done either manually with labor or mechanically using specialized machinery.
Thirdly, the sugar canes are crushed and ground using a special equipment to produce the juice which is then purified through a funnel with the limestone filter. The fifth stage essentially involves this purified juice being poured into an evaporator where under high temperatures, will be turned into a syrup.
After this, the syrup is centrifuged to separate the sugar crystals from it. Eventually in the seventh stage, the syrup is then dried and cooled to produce sugar.
1. no overall summary limits your score for task achievement to
2. -1 of task achievement for being under 150 words
= 4 for task achievement
For details about my writing service please refer to the link below:
https://www.ieltsanswers.com/writing-correction-ielts.html
The charts above depicts the changes that ownership of electrical appliances ,and amount of time doing housework had went through from 1920 to 2019 percentagewise.
Overall, all three appliances namely washing machine , refrigerator and vacuum cleaner experienced upward trend during the century, and it caused a decrease in amount of time spent for household work.
In the first chart, the use of refrigerator and vacuum cleaner, reached it’s maximum of 100% in 1980 and 2000 respectively, and stayed unchanged during the rest of the period. The figure for washing machines was at 40% in 1920 by the year of 1960 this number rose to 70 percent, and followed by a decline until 1980. From 1980 to 2019 the percentage for washing machines saw steady increase and reached it’s peak of roughly 75% in 2019.
The popularity of household appliances contributed to the reduction in the amount of time spent for housework, thus it only decreased during the century, except for the period from 1980 to 2000 where the time spent stayed stagnant. In 1920 the number of hours was 50 hours per week by the end of 2019 this figure fell to 10 hours.
The main issue with this task is that you haven’t covered the data well; such as:
The starting numbers for refrigerators and vacuum cleaners. Only washing machines were covered sufficiently
House workers covered in a strange way. You should respond in chronological order = from 1920 to 2019. Instead, you have described it the other way around which doesn’t work as well
for complete correction of your task I have a service: https://www.ieltsanswers.com/writing-correction-ielts.html